Porfolio Finder


A Python library, based primarily around pandas, to identify an optimal portfolio allocation through back-testing.
API Documentation is available on Read the Docs.
Example Usage
Each of these examples make use of data.csv which provides returns for a handful of funds over 1970-2019.
Find best portfolio allocation to minimize the required timeframe to achieve a target value
from portfoliofinder import Allocations

Allocations(0.05, ['USA_TSM', 'WLDx_TSM', 'USA_INT', 'EM'])\
    .filter('USA_TSM>=0.6 & WLDx_TSM<=0.2 & USA_INT>=0.3')\
    .with_returns("data.csv")\
    .with_regular_contributions(100000, 10000)\
    .get_backtested_timeframes(target_value=1000000)\
    .get_statistics(['min', 'max', 'mean', 'std'])\
    .filter_by_min_of('max')\
    .filter_by_max_of('min')\
    .get_allocation_which_min_statistic('std')
Output
Statistic
min     14.000000
max     22.000000
mean    16.965517
std      2.809204
Name: Allocation(USA_TSM=0.65, WLDx_TSM=0.0, USA_INT=0.3, EM=0.05), dtype: float64
Find best portfolio allocation to maximize value with minimal risk over a fixed timeframe
from portfoliofinder import Allocations

Allocations(0.05, ['USA_TSM', 'WLDx_TSM', 'USA_INT', 'EM'])\
    .filter('USA_TSM>=0.6 & WLDx_TSM<=0.2 & USA_INT>=0.3')\
    .with_returns("data.csv")\
    .with_regular_contributions(100000, 10000)\
    .get_backtested_values(timeframe=10)\
    .get_statistics(['mean', 'std'])\
    .filter_by_gte_percentile_of(90, 'mean')\
    .get_allocation_which_min_statistic('std')
Output
Statistic
mean    446560.590088
std     117448.007302
Name: Allocation(USA_TSM=0.6, WLDx_TSM=0.0, USA_INT=0.3, EM=0.1), dtype: float64
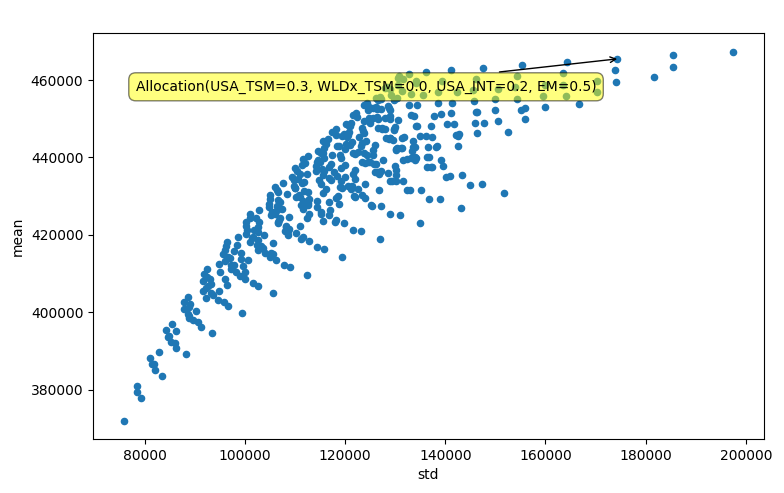
Graph statistics from multiple portfolio allocations to visualize their efficient frontier
from portfoliofinder import Allocations

Allocations(0.05, ['USA_TSM', 'WLDx_TSM', 'USA_INT', 'EM'])\
    .filter('USA_TSM>=0.2 & USA_INT>=0.2')\
    .with_returns("data.csv")\
    .with_regular_contributions(100000, 10000)\
    .get_backtested_values(timeframe=10)\
    .get_statistics()\
    .graph('std', 'mean')
Output